The Journey from Actionable Analytics to Autonomous Service Reliability & Agentic AI
We’ll introduce the 6 common components and 7 AI Workers of our Causal Reasoning Platform, explaining how the platform works to enable autonomous service reliability.
Autonomous Service Reliability is a nirvana we have been trying to get to for several decades. John McCarthy, one of the original pioneers of AI, proposed in 1961 the idea of self-repairing computer programs. Three decades later (in the 1990s), tech giants like IBM pushed the concepts of “autonomic computing” and “self-healing IT systems.”
As an industry, we have made progress in many areas. But when it comes to technology operations and application management fundamentals, we are far from the desired state. No matter what new terms and buzz words people use, the industry still has a way to go. The reality is that no magic black box or new AI trend will get us there on its own.
Autonomous Service Reliability requires a system that autonomically keeps all applications performing and meeting their objectives while satisfying their operational constraints (i.e. the “Desired State”). To continuously maintain the Desired State, the system needs to:
- Assess whether all the applications are in their Desired State
- Pinpoint the root cause(s) and identify the actions that will get the applications that are not in their Desired State back to their Desired State
- Determine what actions will prevent applications from getting out of their Desired State in the first place
- Continuously assess environment trends to identify what actions should be taken to prevent deviation from the Desired State
These are the goals of our Causal Reasoning Platform, which is a model-driven, purpose-built Agentic AI system that includes multiple AI Workers built on a common data model. These AI Workers collaborate seamlessly to continuously assure application reliability and performance. Each of these workers utilizes specific analytics and they all share the common components of the Causal Reasoning Platform.
There are seven AI Workers delivered by our Causal Reasoning Platform, sharing six common components. In this post, we’ll first introduce the six common components followed by a description of the seven workers, explaining what each worker is doing and how the platform works.
Causal Models
The Causal Reasoning Platform is driven by Causal Models. Causely is delivered with built-in Causal Models that capture the root causes that can degrade application performance. These Causal Models enable Causely to automatically pinpoint root causes as soon as it is deployed in an environment with zero configuration.
There are at least a few important details to highlight about these Causal Models:
- They capture potential root causes in a broad range of entities including applications, databases, caches, messaging, load balancers, DNS, compute, storage, and more.
- They describe how the root causes will propagate across the entire environment and what symptoms may be observed when each of the root causes occurs.
- They are completely independent from any specific environment and are applicable to any modern application environment.
Attribute Dependency Models
Causely is delivered with built-in Attribute Dependency Models that extend the Causal Models to capture the dependencies between attributes across entities and the constraints attributes must satisfy. These Attribute Dependency Models enable Causely to automatically correlate performance trends across the entire environment, figure out the Desired State (as described earlier) and the actions to keep the environment in that state.
There are at least a few important details to highlight about these Attribute Dependency Models:
- They can capture attribute dependencies in a broad range of entities including services, applications, databases, caches, messaging, load balancers, DNS, compute, storage, and more.
- They describe the functions between the attributes, but more importantly the functions can be learned.
- They describe the desired state in terms of the applications' goals and the constraints they should operate within.
- They are completely independent from any specific environment and are applicable to any modern application environment.
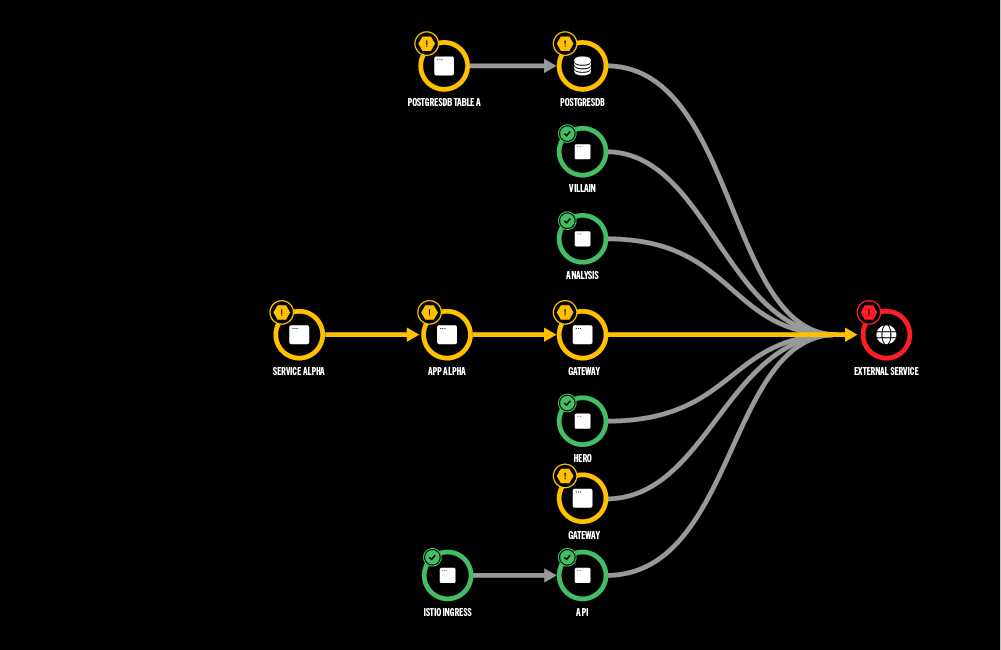
Automatic Topology Discovery
Cloud-native environments are a tangled web of applications and services layered over complex and dynamic infrastructure. Causely automatically discovers all the entities in the environment including the applications, services, databases, caches, messaging, load balancers, compute, storage, etc., as well as how they all relate to each other.
For each discovered entity, Causely automatically discovers its:
- Connectivity - the entities it is connected to and the entities it is communicating with horizontally
- Layering - the entities it is vertically layered over or underlying
- Composition - what the entity itself is composed of
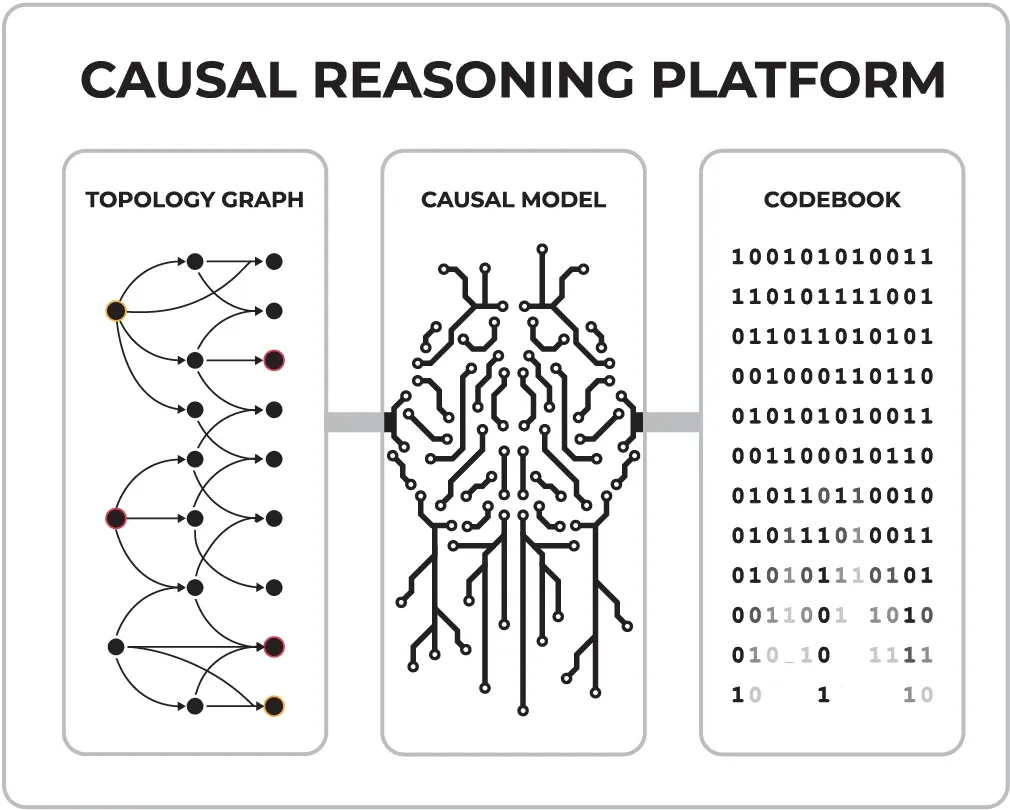
Causely automatically stitches all of these relationships together to generate a Topology Graph, which is a clear dependency map of the entire environment. This Topology Graph updates continuously in real time, accurately representing the current state of the environment at all times.
Automatic Causality Mapping Generation
Using the out-of-the-box Causal Models and the Topology Graph as described above, Causely automatically generates a causal mapping between all the possible root causes and the symptoms each of them may cause, along with the probability that each symptom would be observed when the root cause occurs.
Causely automatically generates two data structures to capture the causality mapping:
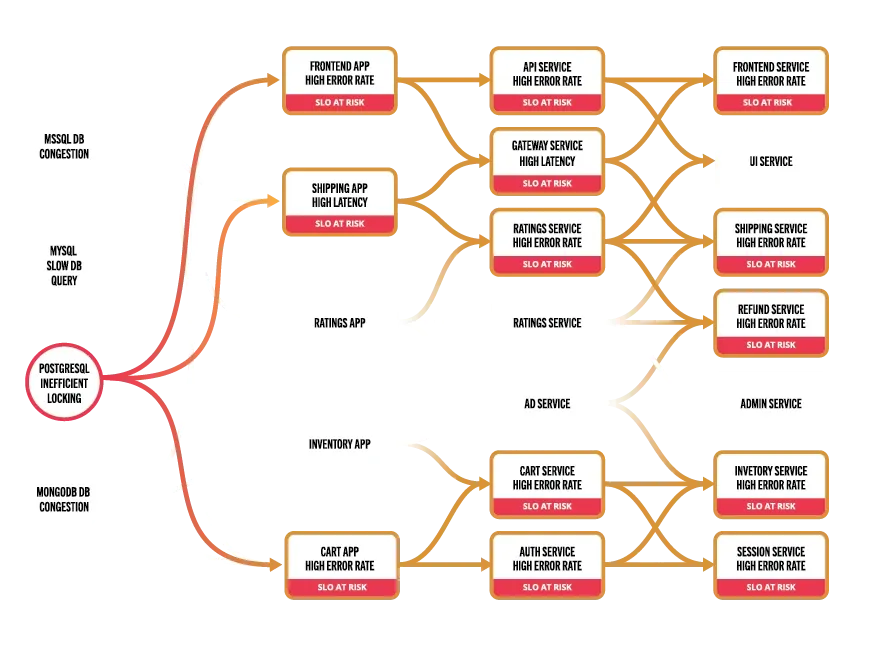
- A Causality Graph is a directed acyclic graph (DAG), where the nodes are root causes and symptoms and the edges represent the causality, i.e., an edge from node A to node B means that A may cause B. The edges are labeled with the probability of the causality.
- A Codebook is a table where the columns represent the root causes and the rows represent the symptoms. Each column is a vector of probabilities defining a unique signature of the root cause. A cell in the vector represents the probability that the root cause may cause the symptom.
Automatic Attribute Dependency Graph Generation
Using the out-of-the-box Attributes Dependency Model and the Topology Graph as described above, Causely automatically generates an Attribute Dependency Graph.
The Attribute Dependency Graph is a directed acyclic graph (DAG) where:
- The nodes are attributes.
- The edges represent a dependency between the attributes. For example, an edge from attribute A to attribute B means that the value of B is a function of attribute A.
- The edges are labeled with the functions. The functions can be defined in the Attributes Dependency Model or can be learned if they are not defined in the Model.
- The nodes representing attributes that must satisfy a constraint will be decorated with the constraint the attribute must satisfy.
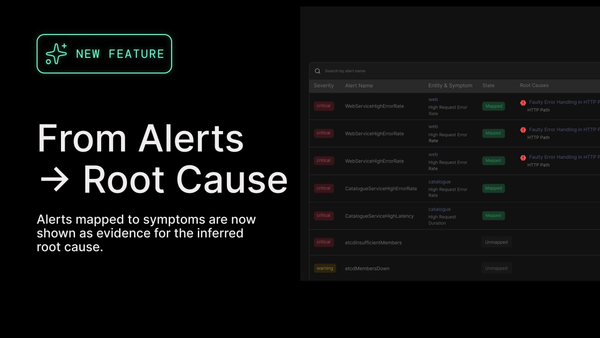
Contextual Presentation
We believe explainability is a critical capability for AI-driven systems to demonstrate. For this purpose, the system presents its work intuitively in the Causely UI. This enables users to see the root causes, related symptoms, the service impacts and initiate actions. These insights can also be sent to external systems to initiate incident response workflows as well as to notify teams who are responsible for taking action and/or those whose services are impacted.
The Models, the automated topology discovery, and the automatic generation of the Causality Mapping and the Attribute Dependency Graph empower multiple AI workers that together deliver an autonomous application reliability system that continuously assures application performance.
Root Cause Analysis (RCA) Worker
The RCA Worker uses the Codebook described above to automatically pinpoint root causes based on observed symptoms in real time. No configuration is required for the worker to immediately pinpoint a broad set of root causes (100+), ranging from applications malfunctioning to services congestion to infrastructure bottlenecks.
In any given environment, there can be tens of thousands of different root causes that may cause hundreds of thousands of symptoms. Causely prevents SLO violations by detangling this mess and pinpointing the root cause putting your SLOs at risk and driving remediation actions before SLOs are violated. For example, Causely proactively pinpoints if a software update changes performance behaviors for dependent services before those services are impacted.
Performance Analysis Worker
The Performance Analysis Worker uses the Attribute Dependency Graph and Causality Graph to analyze microservices performance bottleneck propagation by automatically learning, based on your data:
- The correlation between the loads on services, i.e., how a change in load of one cascades and impacts the loads on other services;
- The correlation between services latencies, i.e., how latency of one cascades and impacts the latencies of other services; and
- The likelihood a service or resource bottleneck may cause performance degradations on dependent services.
Constraint Analysis Worker
The Constraint Analysis Worker uses the Attribute Dependency Graph decorated with performance goals like throughput and latency, as well as capacity and/or cost constraints, to automatically compute the Desired State of the environment and to figure out what actions need to be taken to assure the goals are accomplished while satisfying the defined constraints.
Prevention Analysis Worker
The Prevention Analysis Worker uses the Causality Graph and the Attribute Dependency Graph to enable prevention analysis. Teams are empowered to analyze the potential impacts or problems of changes.
Teams can ask "what if'' questions to:
- Understand the services that may be degraded if a potential problem were to occur
- Understand the impact a planned change may have on services
In doing so, teams can support planning of service/architecture changes, maintenance activities, and service resiliency improvements, and assure that none of these cause unexpected outages that may dramatically impact the business.
Predictive Analysis Worker
The Predictive Analysis Worker uses machine learning (ML) together with the Causality Graph and the Attribute Dependency Graph for predictive analysis. Causely uses:
- ML to analyze the performance behavior of a small subset of attributes, e.g. some services loads, to predict their trends.
- The Attribute Dependency Graph and the predicted trends to predict the state of the environment, i.e., the state of all the attributes.
- The Causality Graph and the predicted future state to pinpoint potential bottlenecks and suggest actions that may prevent bottlenecks.
In doing so, Causely pinpoints the actions required to prevent future degradations, SLO violations, or constraint violations.
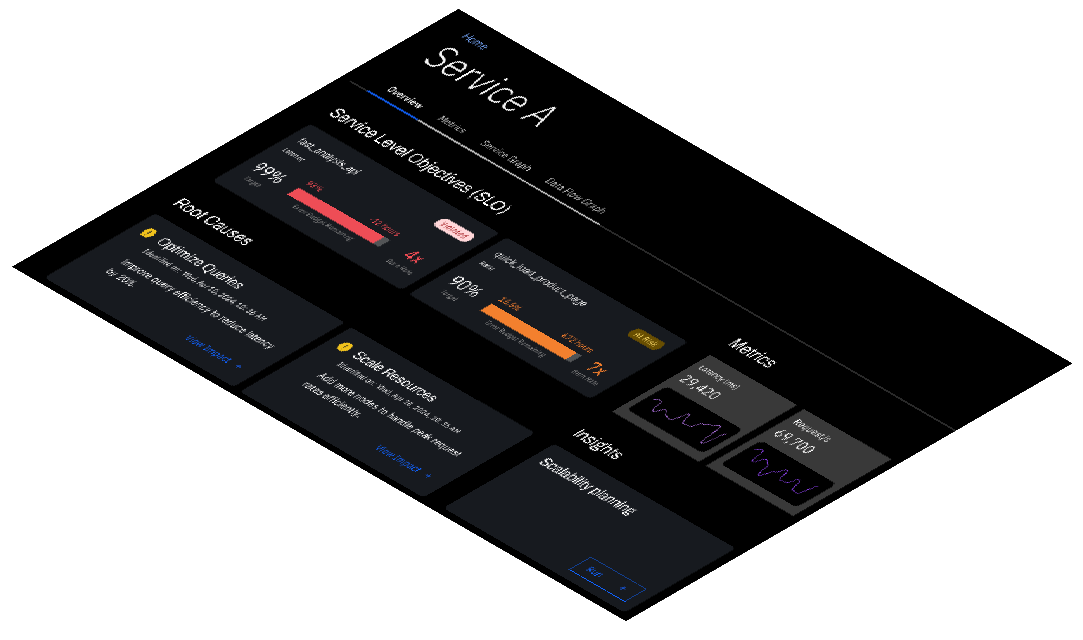
Service Impact Analysis Worker
The Service Impact Analysis Worker uses the Causality Graph to automatically analyze the impact of the root causes on SLOs, prioritizing the root causes based on the violated SLOs and those that are at risk. Causely automatically defines standard SLOs (based on latency and error rate) and uses machine learning to improve its anomaly detection over time. However, environments that already have SLO definitions in another system can easily be incorporated in place of Causely’s default settings.
Postmortem Analysis Worker
The Postmortem Analysis Worker uses the Causality Graph to save the relevant context of prior incidents to enable postmortem analysis. Causely saves the root cause, the Causality Graph of the root cause, the symptoms in the Causality Graph and the relevant attribute trends. Teams can review prior incidents and see clear explanations of why these occurred and what the effect was, simplifying the process of postmortems and enabling actions to be taken to avoid re-occurrences.
See Causely for Yourself!
Book a meeting with the Causely team and let us show you how to transform the state of escalations and cross-organizational collaboration in cloud-native environments, or start your free trial now.