How to Turn Slow Queries into Actionable Reliability Metrics with OpenTelemetry
Slow SQL queries degrade UX and reliability. This guide shows how to distill OpenTelemetry DB spans into actionable metrics: build span-derived slow-query dashboards, rank queries by traffic impact, and detect regressions with anomaly baselines, so you fix what matters first. Hands-on lab included.


Slow SQL queries degrade user experience, cause cascading failures, and turn simple operations into production incidents. The traditional fix? Collect more telemetry. But more telemetry means more things to look at, not necessarily more understanding.
Instead of treating traces as a data stream we might analyze someday, we should be opinionated about what matters at the moment of decision. As we argued in The Signal in the Storm, raw telemetry only becomes useful when we extract meaningful patterns.
In this guide, you’ll build a repeatable workflow that turns OpenTelemetry database spans into span-derived metrics you can dashboard and alert on—so you can identify what’s slow, what matters most, and what just regressed.
We’ll make this concrete with slow SQL queries, serving two use cases:
- Optimization: Which queries yield the most value if made faster, weighted by traffic?
- Incident response: Which queries are behaving abnormally right now?
We’ll build a lab where your app emits OpenTelemetry traces, and we distill those into actionable metrics, starting with simple slow query detection, then adding traffic-weighted impact, and finally anomaly detection.
The Signal in the Storm: Practical Strategies for Managing Telemetry Overload - Endre Sara
What Makes a Query Slow?
“Slow” isn’t a single problem. It’s a symptom with fundamentally different causes. A 50ms query might be fine for a reporting dashboard but catastrophic for checkout. As High Performance MySQL emphasizes, understanding why a query is slow determines how to fix it. Here are the most common problems that may cause slow queries:
Excessive Work
The database does more than necessary—typically full table scans due to missing or unusable indexes. Without an index on customer_id, a simple SELECT * FROM orders WHERE customer_id = $1 grows from 20ms at 10K rows to minutes at 10M rows. The query didn’t change; the data volume did. See Use The Index, Luke! for the fundamentals.
Aggregations and joins compound this. Even indexed queries can explode when the planner misjudges cardinality and chooses the wrong join strategy.
Resource Contention
Perfectly optimized queries can be slow when waiting for resources. Lock contention blocks queries until other transactions release rows. Connection pool exhaustion adds latency before the query even starts. A query spending 95% of its time waiting for locks won’t be fixed by query optimization—it needs transaction redesign.
Environmental Pressure
CPU saturation, I/O bottlenecks, and memory pressure can slow any query. The same SQL with the same plan performs completely differently under resource contention.
Plan Regressions
Performance degrades when execution plans change—even with identical queries and data. Parameter-sensitive plans optimize for one set of values but fail for others. Stale statistics after bulk loads cause the planner to choose terrible strategies. The PostgreSQL Performance Tips documentation covers how to catch these regressions.
Pathological Patterns
Some slowness doesn’t appear in slow query logs. The N+1 problem executes 100 fast queries (2ms each) sequentially, adding 200ms latency plus network overhead. No individual query is “slow,” but the pattern is catastrophic.
The classic workflow: DB-native tooling + manual triage
Databases ship with excellent diagnostic tools: slow query logs, query stores like PostgreSQL’s pg_stat_statements, and plan inspection with EXPLAIN. These tell you what’s expensive inside the database.
What they don’t provide is context. Which service triggered the slow query? Is it user-facing or background work? Does it correlate with the latency spike you’re investigating? You’re left with a list of slow queries and no signal about which ones matter most.
Typically, someone bridges this gap manually: a developer notices a slow endpoint, brings the query to a DBA, and they optimize it together. This works, but that manual linking is exactly what we can automate.
Bringing Context to Slow Queries
Database tools tell you what is slow, but not why it matters. When you find a slow query in your logs, you’re missing critical context: Which service triggered it? Is it user-facing or background work? Does it correlate with the latency spike you’re investigating?
Distributed traces provide this context. Each database span is embedded in a request context—it knows which service, endpoint, and user triggered it.
Instead of correlating database logs and traces after the fact, we analyze slow queries directly from traces with all the application context built in.
The Building Blocks
Now that we understand the philosophy and the value of context-rich traces, let’s look at the building blocks we’ll use to implement slow query analysis.
The Observability Stack
For our lab, we use the OpenTelemetry Collector paired with docker-otel-lgtm—a pre-packaged stack from Grafana that bundles Loki, Grafana, Tempo, and Mimir in a single container. This gives us a complete observability environment with minimal setup.
The Application
Our sample application is a simple Go-based “Album API” that serves music album data from PostgreSQL. It’s intentionally designed to produce the kind of intermittent slow queries that are common in production. They services use otelsql to instrument database calls, emitting spans with the stable OpenTelemetry database semantic conventions.
The Dashboards
We’ll build three dashboards, each adding a layer of insight:
- A simple view of the queries by duration
- Queries weighted by traffic to surface optimization opportunities
- Anomaly detection to identify queries deviating from their normal behavior
Lab Setup
Let’s put the theory into practice. We’ll clone a sample application, start the observability stack, and explore three progressively more sophisticated approaches to slow query analysis. All you need is Docker installed.
Clone and Run
git clone https://github.com/causely-oss/slow-query-lab
cd slow-query-lab
docker-compose up -d
Once running, open Grafana at http://localhost:3001—that’s where we’ll explore our dashboards.
Queries by Duration
The first dashboard takes the most direct approach: query Tempo for database spans and aggregate them to find queries that take the longest time. This is what you’d naturally build when you first start exploring traces for slow query analysis.
What It Shows
The Slow SQL - By Duration dashboard queries traces directly using TraceQL:
{ span.db.system != "" } | select(span.db.query.text, span.db.statement)This finds all spans with database attributes, then uses Grafana transformations to:
- Group by root operation (API endpoint) and SQL statement
- Aggregate duration into mean, max, and count
- Sort by average duration (slowest first)
The result is a table showing your slowest queries, which endpoints triggered them, and how often they occur.
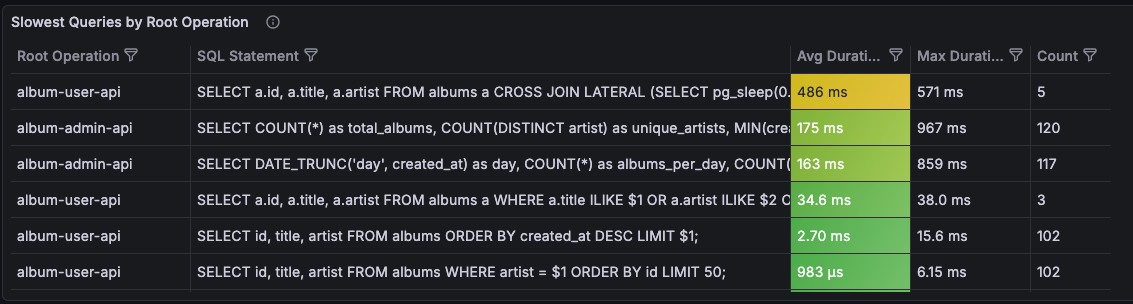
What’s Good About This
This approach gives you immediate visibility into queries with full application context:
- You can see exactly which SQL statements are taking the most time
- You know which API endpoints trigger them
- You have the count to understand frequency
- You can click through to individual traces for debugging
It’s a first improvement over raw database logs because you’re already seeing the application context that makes slow queries actionable.
The Limitation
Here’s the problem: sorting by average duration doesn’t tell you which queries matter most.
Consider two queries:
| Query | Avg Duration | Count |
|---|---|---|
| Complex report | 2.3s | 5 |
| Search | 150ms | 10,000 |
The complex report is “slower” by average duration, so it appears first. But the search query, despite being faster on average, runs 2,000 times more often. Its aggregate impact on your users is far greater.
This dashboard tells you what’s slow, but not what’s impactful. For that, we need to consider traffic volume.
Traffic-Weighted Impact Analysis
The second dashboard addresses this limitation by introducing an impact score: the product of average duration and call count.
What It Shows
The Slow SQL - Traffic Weighted dashboard uses the same TraceQL query but adds a calculated field:
Impact = Avg Duration × CountThis simple formula captures a key insight: a moderately slow query that runs thousands of times has more total impact than a very slow query that runs rarely. The dashboard sorts by impact score, surfacing the queries that matter most to your users.
The dashboard also adds:
- Service breakdown: See which service triggered each query
- Latency distribution: Visualize duration over time, not just averages
- Top queries by impact: A quick view of where to focus optimization efforts
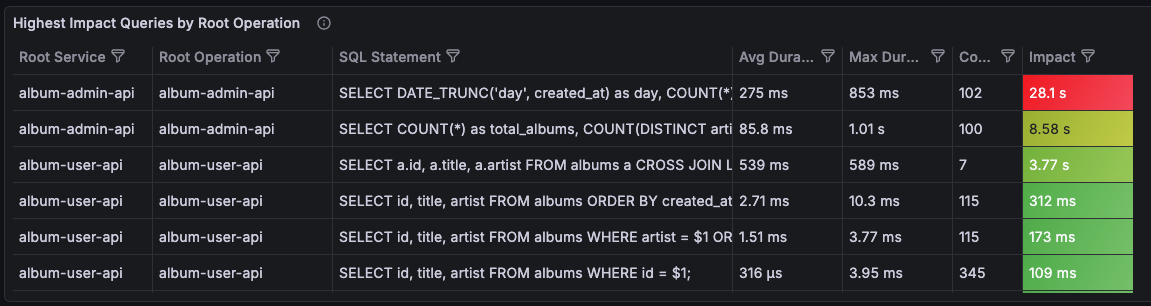
What’s Good About This
Traffic-weighted impact gives you a much better prioritization signal for optimization work:
- High-volume, moderately-slow queries surface above rare-but-slow ones
- You can justify optimization work with concrete impact numbers
- The service and endpoint context helps you route issues to the right team
When someone asks “which slow queries should we optimize first?”, this dashboard gives you a defensible answer. It’s exactly what you need for planning performance improvements.
The Limitation
But this dashboard is for optimization, not incident response. Even with traffic-weighted impact, it can’t answer a critical question:
“What has changed?”
Suppose your search query has an impact score of 150,000. Is that normal? Is it higher than yesterday? Higher than last week? The dashboard shows you a snapshot of current state, but it has no concept of baseline.
This matters enormously during incidents. When latency spikes, you don’t just want to know “search queries are slow”—you want to know “search queries are slower than normal”. You need to distinguish between:
- A query that’s always been slow (known behavior, maybe acceptable)
- A query that just became slow (new problem, needs investigation)
Without a baseline, every slow query looks the same. You’re left manually comparing current values to your memory of what’s “normal,” or digging through historical data to establish context.
This is the gap that the third dashboard addresses.
Symptom Detection with Anomaly Baselines
Because of these limitations, the third dashboard changes our approach: instead of just querying traces, we distill metrics from spans and then apply anomaly detection to identify deviations from normal behavior.
The Setup
For this dashboard, we add the spanmetrics connector to the OpenTelemetry Collector. Here’s the relevant part of the collector configuration:
connectors:
  spanmetrics:
    dimensions:
      - name: db.system
        default: "unknown"
      - name: db.query.text
      - name: db.statement
      - name: db.name
        default: "unknown"
    exemplars:
      enabled: true

service:
  pipelines:
    traces:
      receivers: [otlp]
      processors: [transform, batch]
      exporters: [spanmetrics, otlphttp/lgtm]

    metrics:
      receivers: [spanmetrics]
      processors: [batch]
      exporters: [otlphttp/lgtm]
The spanmetrics connector examines every database span and generates histogram metrics for query latency, labeled by:
service_name: Which service made the querydb_system: Database type (postgresql)db_query_textordb_statement: The SQL querydb_name: Database name
These metrics are stored in Mimir (the Prometheus-compatible backend in docker-otel-lgtm), where we can apply PromQL-based anomaly detection.
Anomaly Detection with Adaptive Baselines
The sample app includes Prometheus recording rules from Grafana’s PromQL Anomaly Detection framework. These rules calculate:
- Baseline: A smoothed average of historical values (what’s “normal”)
- Upper band: Baseline + N standard deviations (upper threshold)
- Lower band: Baseline - N standard deviations (lower threshold)
When current values exceed the bands, we have an anomaly—a clear signal that something has changed.
What It Shows
The Slow SQL - Anomaly Detection dashboard displays:
- Current latency plotted against the adaptive baseline bands
- Anomaly indicators when latency exceeds normal bounds
- Per-query breakdown so you can see which specific queries are anomalous
The key insight is the visual comparison: instead of just showing “p95 latency is 450ms”, it shows “p95 latency is 450ms, which is above the expected range of 200-350ms.”
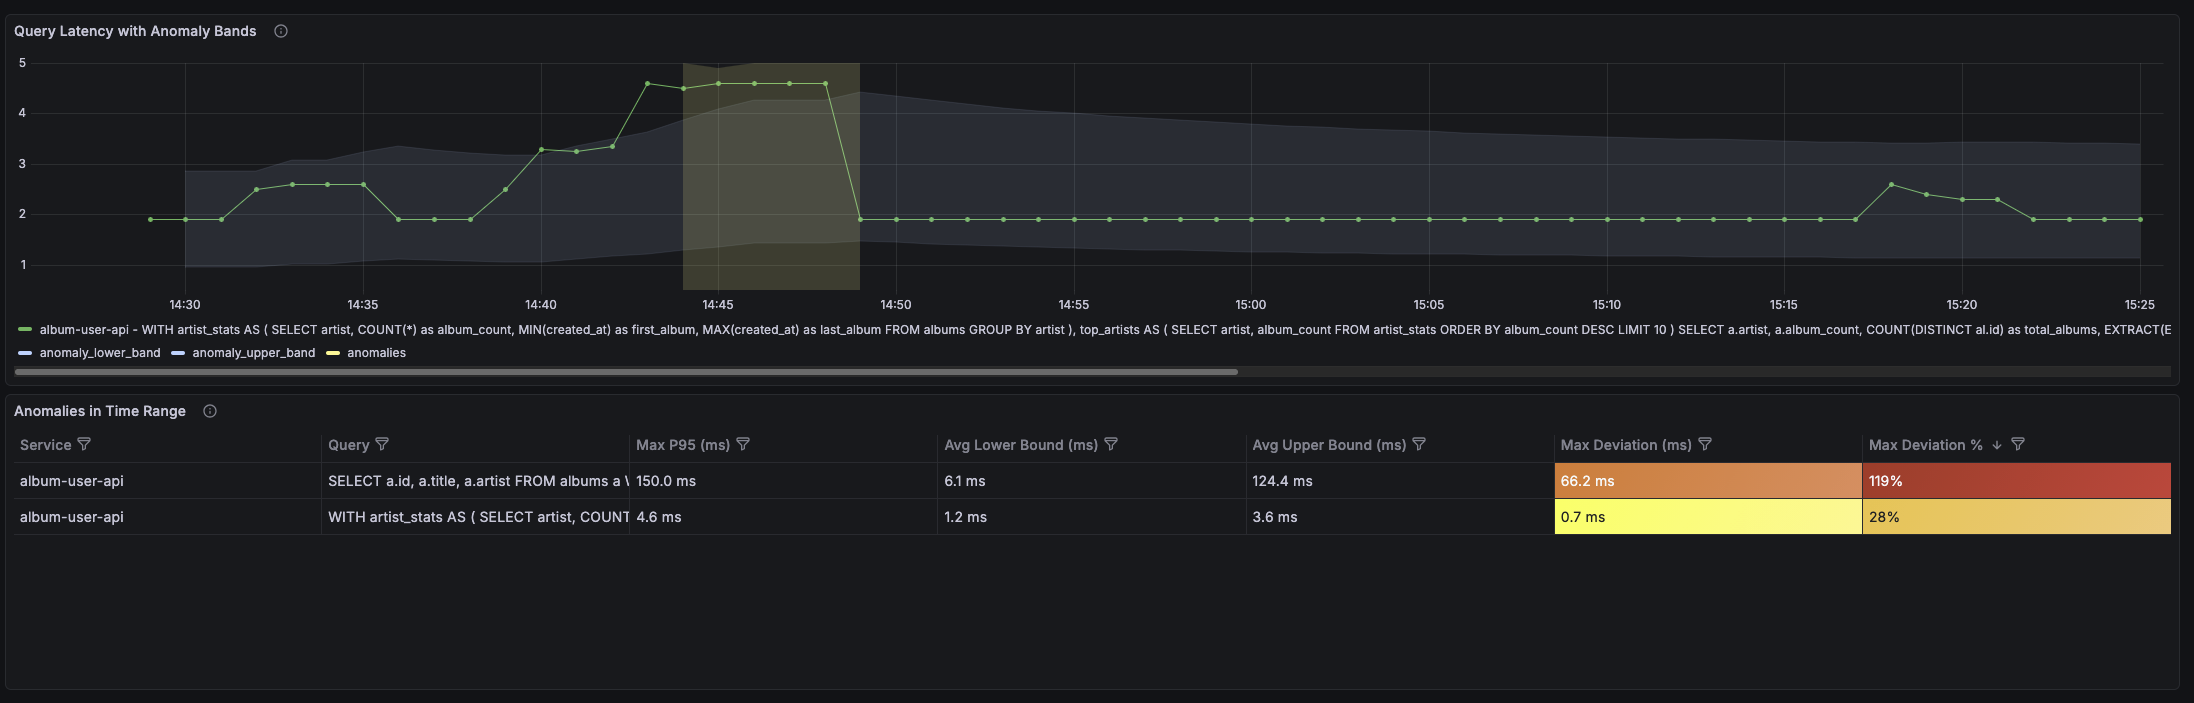
Why This Is Better
This dashboard answers the question the previous one couldn’t: “What has changed?”
- A query that’s always slow (450ms baseline) won’t trigger anomalies when it runs at 450ms
- A query that’s normally fast (50ms baseline) will trigger anomalies if it suddenly runs at 200ms
- You get automatic context for what’s “normal” without maintaining manual thresholds
The anomaly detection acts as a symptom detector. It tells you: “This query is behaving differently than it usually does.” That’s a high-signal insight you can act on immediately.
From Metrics to Symptoms
Notice what we’ve achieved with this architecture:
- Raw telemetry (traces) flows from the application
- Distillation (spanmetrics connector) extracts metrics from those traces
- Anomaly detection (Prometheus rules) identifies deviations from baseline
- Symptoms (anomalous queries) surface for investigation
We went from thousands of trace spans to a handful of anomaly signals that tell you exactly where to look.
Taking This to Production
Metric Cardinality
Raw SQL in metric labels will explode your metrics backend—SELECT * FROM orders WHERE customer_id = 12345 becomes a separate series per customer. Use prepared statements (so instrumentation captures templates, not literals), normalize query text, or use aggregation_cardinality_limit in the spanmetrics connector.
Privacy
SQL may contain sensitive data. The Collector is the ideal place to redact: drop or transform sensitive attributes before shipping downstream. This aligns with distillation: sanitize at the edge, not centrally.
Anomaly Detection Baseline
Adaptive rules need 24-48 hours of data to establish baselines. Start with wider bands and tighten as confidence grows.
The Remaining Gap: From Symptoms to Root Causes
Even with anomaly detection, you’re still looking at symptoms. In real-world incident scenarios, especially in large environments, slow queries are just one of many symptoms that pop up at once. You’re not only trying to understand the cause of this one; you’re triaging a flood of alerts and correlating many symptoms to find the real root cause.
When the dashboard shows “search query latency spiked,” you know something changed. But you don’t know why it changed. The root cause might be:
- A missing index after a schema migration
- Query plan regression due to stale statistics
- Lock contention from a concurrent batch job
- Resource pressure from a noisy neighbor on the database host
- Upstream service degradation causing retry storms
Connecting the symptom (“search query is slow”) to the root cause (“index was dropped during last night’s migration”) requires causal reasoning—understanding the relationships between system components and tracing the chain of causation from effect back to cause.
You can absolutely do this reasoning yourself. Look at deployment timestamps, check for schema changes, investigate resource metrics, correlate with other symptoms. Good engineers do this every day.
But it’s manual, time-consuming, and doesn’t scale.
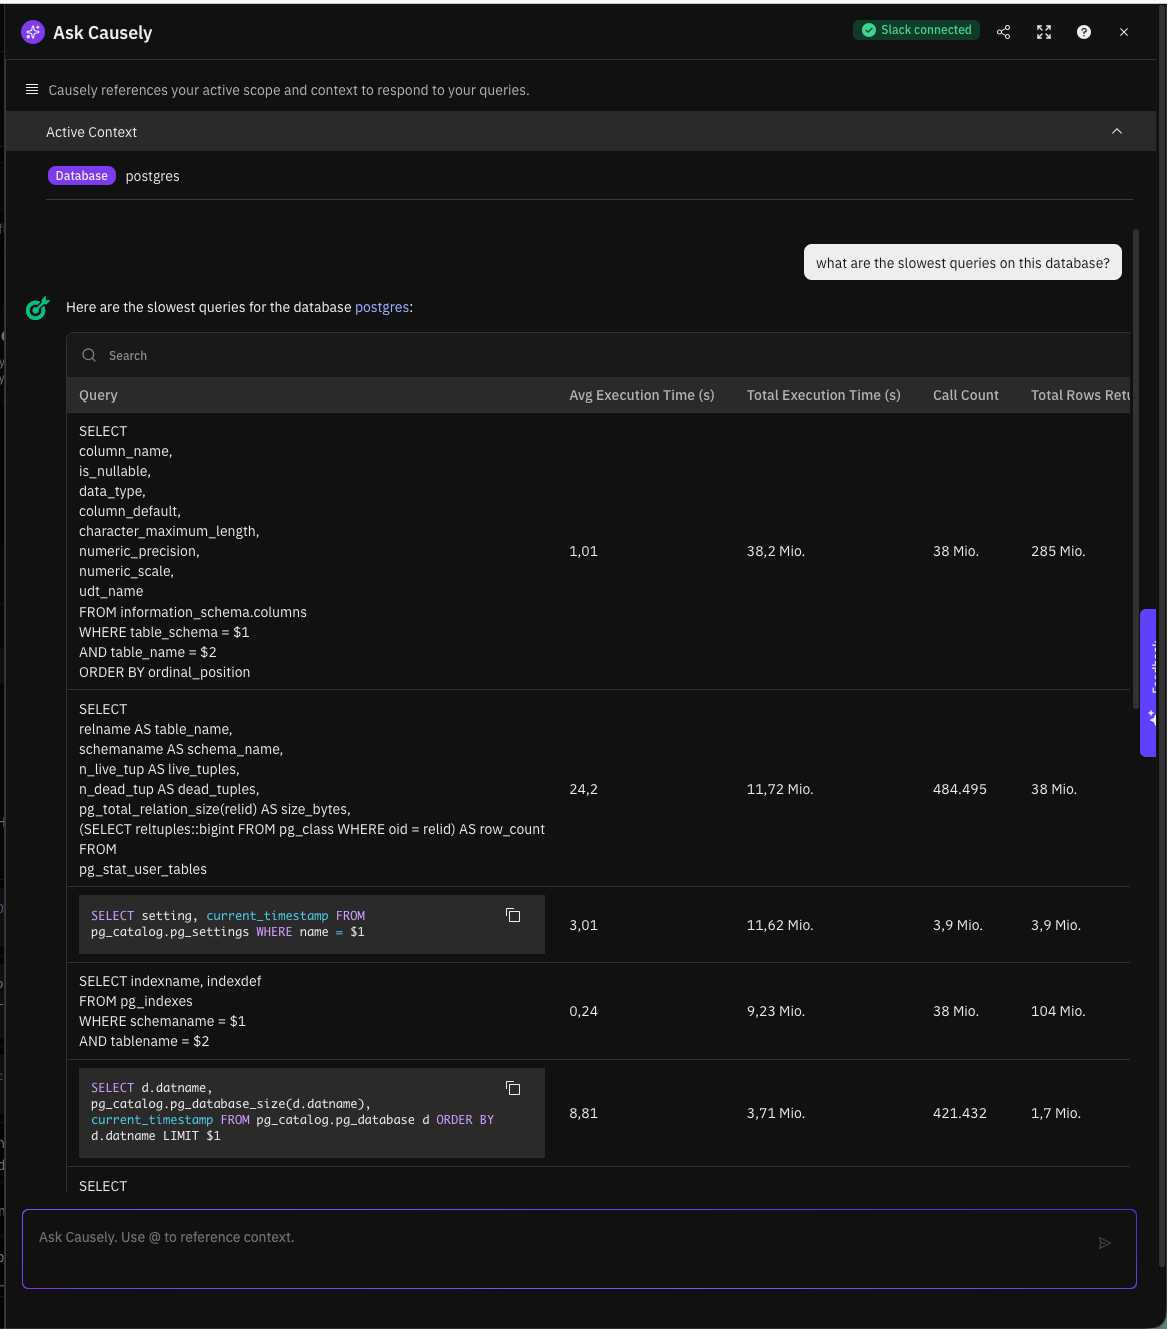
Going Beyond Symptoms with Causely
This is where Causely comes in: Causely extracts slow queries (and other symptoms) as distilled insights out of the box—the same pattern we implemented manually. But it goes further:
- Causal model: Slow queries are connected into a model of your system’s dependencies. You can see what they impact (which endpoints, which users) and what causes them (resource constraints, upstream failures, configuration changes).
- Root cause identification: Instead of showing you a list of symptoms to investigate, Causely traces causation chains to identify the underlying root cause. “Search queries are slow because the index was dropped.”
- Actionable recommendations: AskCausely helps you get to “what should we change?”—whether that’s adding an index, reverting a deployment, or addressing the upstream pressure that made the query slow in the first place.
The pattern we built in this post—distill, detect anomalies, surface symptoms—is the foundation. Causely is the natural next step: turning symptoms into root causes at scale.
Want to see how Causely connects your slow queries to their root causes? Try it yourself.